Machine Learning
13 Jun 2017 | machine-learningMachine learning is the science of getting computers to learn to perform a task without being explicitly programmed.
A Dataset can be represented by a matex \(X\), where each column is a feature and each row is a sample. \(Y\) is a vector of labels/outputs.
Machine learning can either be used for Classification or Regression.
The goal of machine learning is to learn a function, \(F(X) = \hat{y}\) to minimize the error, \(\hat{y}-y\)
There are different types of machine learning
- supervised learning, where each example has a \(y\) value
- unsupervised learning, where no labels are provided.
- semi-supervised learning, where some labels are provided.
Discrimiative learning - tries to learn a deciscion boundry by minimizing \(\textbf{w}\) in \(R(\textbf{w}) + C\sum_{i=1}^N{L(y_i, \textbf{w}T\textbf{x}_i)}\)
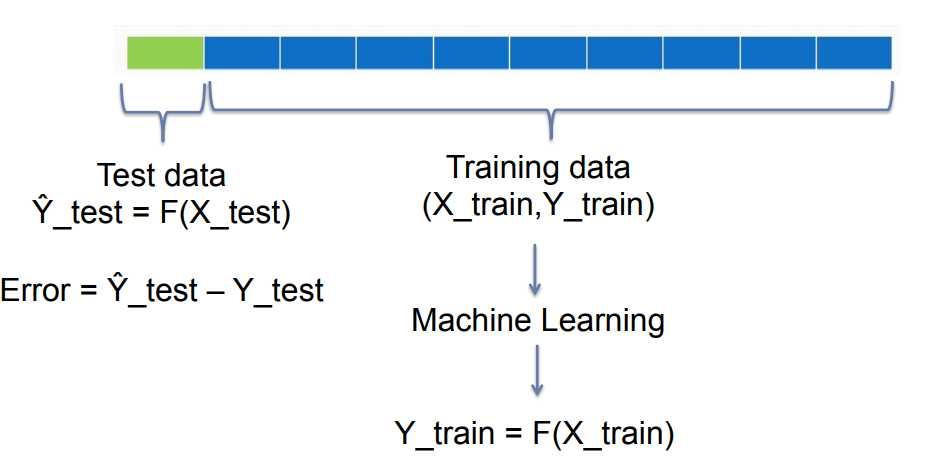
Cross-Validation
Bag of Words Classification
The idea is that each object can be represented by a bag of features, so we don’t care about the relative order of the features but rather the exsistance and number of features.
Macine learning can be used for feature detection, segmentation, denoising, super-resolution, labeling/captioning, prediction and registration.
Machine Learning
Overfitting
It is possible to overfit the trainig set and lose to ability to generalize to the test set.

K-means
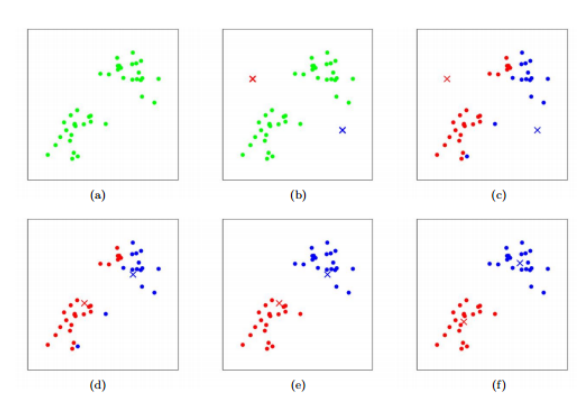
create k centroids randomly

run until convergence
    for each data sample
        assign it to the nearest centroid
    update centroid to be the mean of all associated data points
K-nearest-neighbors
The idea is to look at the k nearest neighbors to determine the label of the current datapoint.

Linear Classifiers
\(y = f(\sum_j{w_jx_j})\)
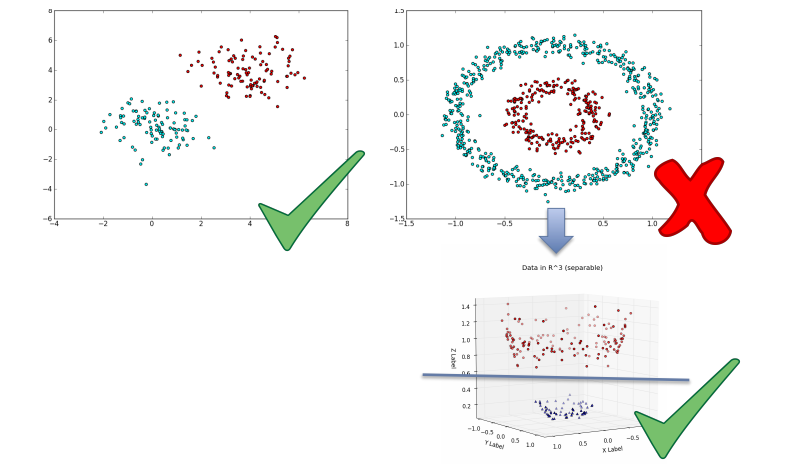
However, some datat is not linearlly seperable. In this case, we can use the kernel trick, which is to project data into a higher dimensionality space where the data is linearly seperable.
One common kernel to use is the Radial Basis Function kernel \(K(x_i, x_j) = exp(-\frac{\| x_i-x_j \|^2}{2\sigma^2})\).
Support Vector Machines
Finds the max-margin hyperplane between two different classes. We use hinge loss for data that is not linearly seperable
Hinge-loss - \(\frac{1}{n}\sum_{i=1}^{n}{max(0, 1 - y_i(w\cdot x_i - b))} + \lambda{\|w\|}^2\)

Decision Trees
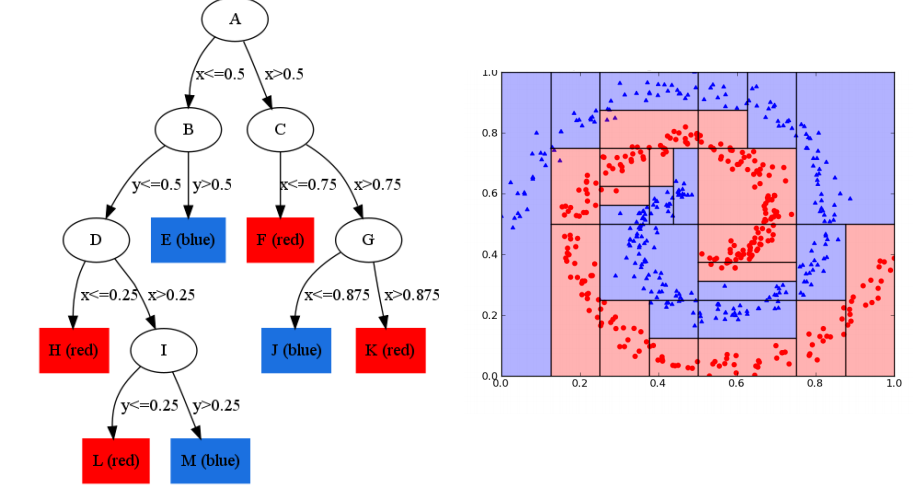
Extremely Randomized Trees
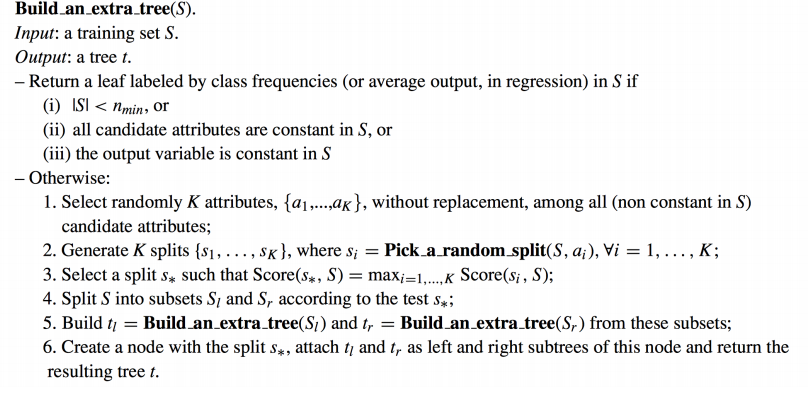
Take either the majority vote or prediction average
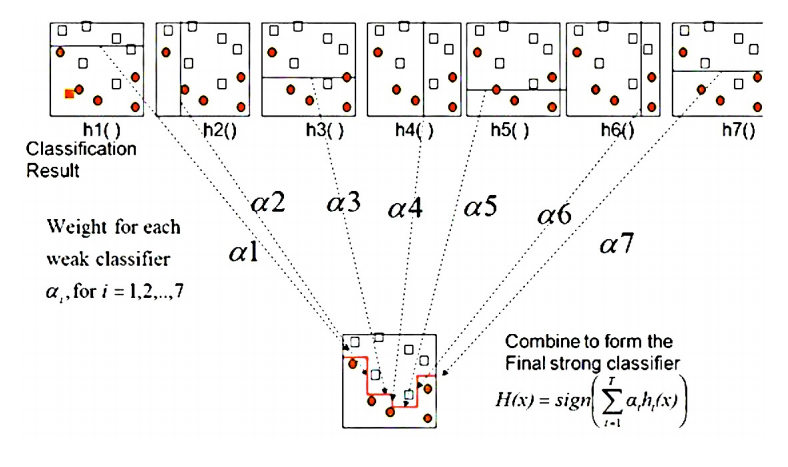
AdaBoost
Train many weak classifiers and combine them to get a final classifier - \(H(x) = sign(\alpha_1h_1(x) + \alpha_2h_2(x) + \alpha_3h_3(x))\)
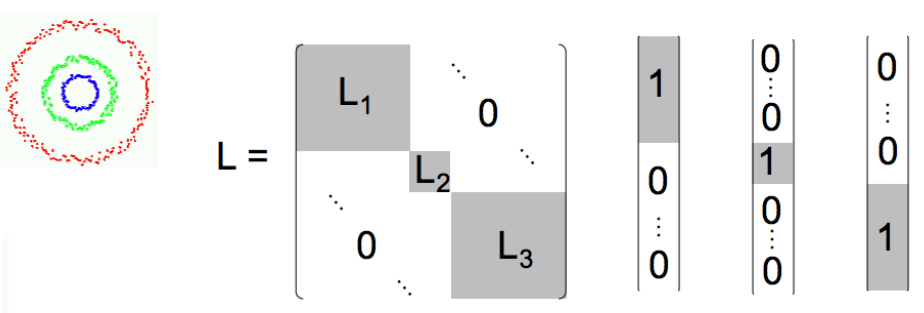
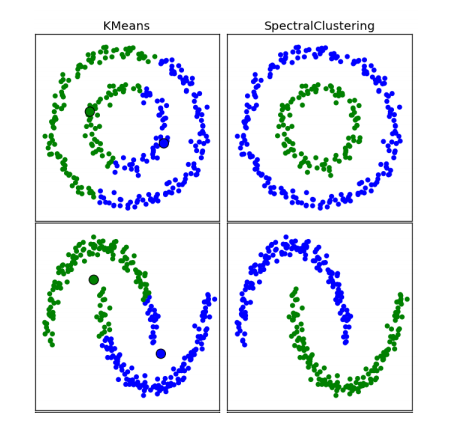
Spectral Methods
Model Fitting
Least-Squares Line fitting
Want to minimize error given by \(E = \|Y-XB\|^2\).
We can solve this by inverting a matrix: \(B = (X^TX)^{-1}X^TY\)
However, this approach is not rotation invariant and unable to represent horizontal/vertical lines. It is also sensitive to noise when the slope is very high.
One solution is to use total least square line fitting which takes the perpendicular distance instead of the vertical distance.
This is the same thing as minimizing \(\sum_{i=1}^n{\frac{(ax_i + by_i+c)^2}{a^2 + b^2}}\), which is the same thing of findiding the eigenvector \(A^TA\) of the least eigenvalue.
However this still leaves the model prone to fitting outliers and sensitive to noise.

RANSAC
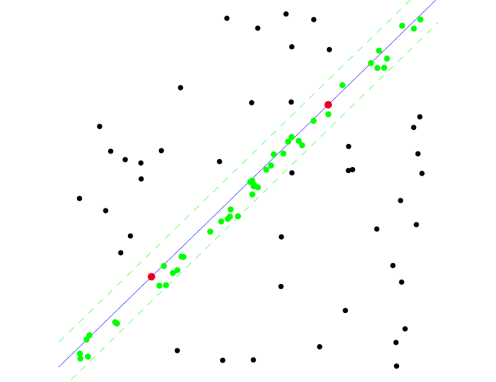
repeat N times:
    randomly choose a small subset of points s
    fit model to points in subset s
    find all remaining points close to model (inliers) and reject all others as outliers
    compute the error of the model
choose the best model
Hough Transform
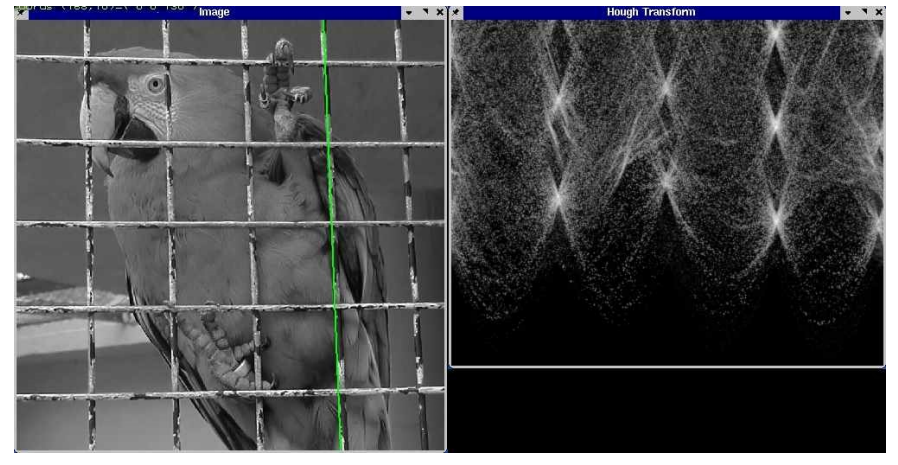
This is a method of voting for parameter estimation. Firstly, you need to convert the points from image space to parameter space.
Each point \((x_0, y_0)\) maps to a line \(b = -x_0a +y_0\) in Hough space. We can represent this in polar form to make things easier.
For each edge point (x,y)
    For t=0 to 180
        r = x cos(t) + y sin(t)
        H(t, r) = H(t,r)+1
Find local maxima in H(t,r)
