Corporate Finance
28 Jan 2017 | miscThese are some notes that I took on corporate finance for ENGR111 at UCLA
The Corporate Firm
- Sole proprietorship - buisness owned by one person
- No formal charter is required
- No corporate income tax (taxed as personal)
- Unlimited liability for buisness debts and obligatioins (personal and buisness assets are the same)
- Life of the propietorship is the life of the individual
- Parternship - Can either be a general parternship or a limited partnership. In a general parternship, all partners are liable for all debts, whereas in a limited partnership allows the liability of some of the partners to be limited to the amount of cash they put in. Usually one partner has to be a general partner and limited partners cannot manage the buisness
- Usually inexcpensize to form
- Unable to transfer ownership of a general partner unless all others agree. Limited partners may sell their buisness though
- Hard to raise large amounts of cash
- Income is taxes as personal income
- Corporation - it’s own seperate legal identity, usually composed of three sets of distinct interests - the shareholders, the directors, and top management.
- Ownership can be easily transfered by selling stock
- Corporation has unlimited life
- There shareholder’s liablilty is limited to what they put in
- Must pay corporate income tax in addition to personal income tax
Goals of Financial Management
In general, there are many goals for different interests, but they usually center around either maxamizing profit or minimizing risk The goal of financial management is to maximize the current value per share of the exsisting stock More generally, we are trying to maximize the value of the existing owners’ equity
Agency Problem
There may be a conflict of interests between the principal and the agent This is usually remedies by tying managerial compensation to the financial eprformance in general of the corporation, Furthermore managers want to ensure that new control does not come, as that usually means they will be replaced. stakeholder - someone other than a stockholder or creditor who has a claim on the cash flows of the firm (spouse, children, etc)
Financial Statements and Cash Flow
Balance Sheet
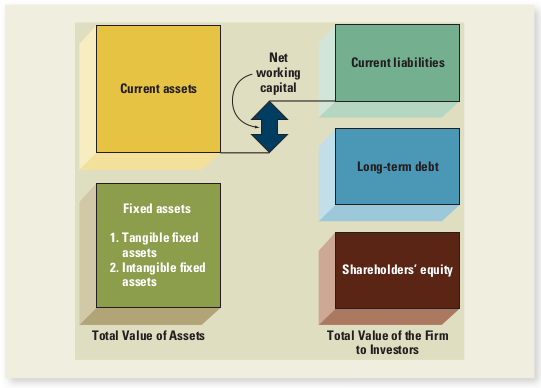
The balance sheet is a representation of a company. It can be used to answer three fundamental questions about a company Common-Size Balance Sheet - divide by Total Assets to get a percentage
- On the left hand side, we can see long-term assets to solve capital budgeting issues
- On the upper half, we can see short-term cash flow and net working capital
- On the right hand side, we can see the investors perception of the company and capital structure issues
When analyzing a balance sheet, you should be aware of liquidity, debt vs. equity, and value vs. cost
- Liquidity - refers to the ease and quickness assets can be converted to cash
- Current assets - most liquid and inclue cash and assets that will be turned into cash within a year
- Accounts receivable - amounts not yet collected from customers for goods or services
- Inventory - raw materials to be used in production or finished goods
- Fixed assets - The least liquid, such as property, plant, equipment (Tangible fixed assets). Can also be intangible, such as the value of a patent or trademark
- Debt vs. Equity
- Liabilities - obligations of the firm that require cash payout within a certain time period
- Debt service - will put firm in default if they are not paid - payments back to creditors
- Stockhoders’ equity - claim against the firm’s assets that is residual and not fixed
- Value vs. Cost
- Carrying value - the accounting value of a firm’s assets using GAAP - the mininum of either cost or market value
- Market value - the price at which buyers/sellers trade the object
Income Statement
\(Revenue - Expenses = Income\)
Common-Size Income Statement - Divide by Total Sales to get a percentage
- Generally accepted accounting principles - revenue is recognized when an exchange of goods or services occurs. Revenues shoud be matched with expenses. Income is reported when it is earned, even though no cash flow ahs necessarily occured. E.g. - selling for credit
- Noncash items - exsist against revenues but do not affect cash flow.
- Deprecation - the cost of equipment used up in the production process
- Deferred taxes - arises from the difference between accounting income and true taxable income
- Time and Costs - visualize short run and long run, where in the short run certain costs are fixed (bond interest, overhead, property taxes), but in the long run all costs are variable
Net Working Capital
\(Current \: Assets - Current \: Liabilities = NWC\)
If net working capital is positive, this means that over the next 12 months, the cash that will come in is greater than the cash thatwill be paid out. The change in net working capital is using positive in a growing firm
Financial Cash Flow
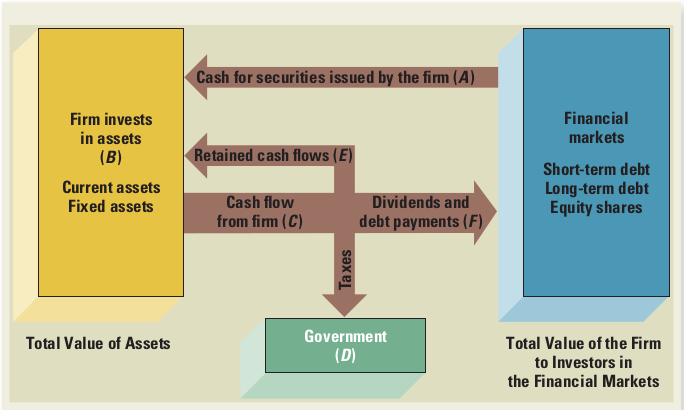
In general cash flows recieved earlier are better than those recieved later.
\[CF_{Assets} = CF_{Creditors} + CF_{Investors}\]- Cash flow from operations - cash flow generated by buisness activities, including sales, but does not reflect changes in finincing, capital spending, or changes in net working capital. \(CF_{Operating}= Earnings - Deprecation - Taxes\)
- Capital spending - \(Capital \: Spending = \Delta NFA + Deprecation\)
- Total/Free cash flow - \(CF_{Total} = CF_{Operating} - Capital \: Spending - NWC \: additions\)
Financial Statement Analysis and Financial Models
Financial Ratios
- Short-Term Solvency or Liquidity Measures
- \[Current \: Ratio = \frac{Current \: Assets}{Current \: Liabilities}\]
- \[Quick \: Ratio = \frac{Current \: Assets - Inventory}{Current Liabilities}\]
- \[Cash \: Ratio = \frac{Cash}{Current \: Liabilities}\]
- Long-Term Solvency Measures
- \[Total \: Debt \: Ratio = \frac{Total \: Assets - Total \: Equity}{Total \: Assets}\]
- \[DE \: Ratio = \frac{Total \:Debt}{Total\:Equity}\]
- \[Equity \: Multiplier = \frac{Total \: Assets}{Total \: Equity}\]
- \[TIE \: ratio = \frac{EBIT}{Interest}\]
- \[Cash \: Coverage \: Ratio = \frac{EBIT + Deprecation}{ Interest}\]
- Asset Management or Turnover Measures
- \[Invetory \: Turnover = \frac{Cost \: of \: goods}{Inventory}\]
- \[Days \: sales \: in \: inventory = \frac{365 \: Days}{Inventory \: Turnover}\]
- \[Total \: Asset \: Turnovers = \frac{Sales}{Total \: Assets}\]
- Profitability Measures
- \[Profit \: Margin = \frac{Net \: Income}{Sales}\]
- \[Return \: on \: Assets = \frac{Net \: Income}{Total \: Assets}\]
- \[Return \: on \: Equity = \frac{Net \: Income}{Total \: Equity}\]
- Market Value Measures
- \[EPS = \frac{Net \: Income}{Shares \: Outstanding}\]
- \[PE \: Ratio = \frac{Price \: per \: share}{Earnings\: per\: share}\]
- \[Market \: Book \: Ratio = \frac{Market \: Value}{Book\: Value}\]
Compare financial raions in Time-Trend Analysis (over time) or Peer Group Analysis (compare to similar companies/within industries)
The DuPont Identity
\[Return \: on \: Equity = \frac{Net \:Income}{Total \: Equity}\] \[Return \: on \: Equity = Profit \: Margin \times Total \: Asset \: Turnover \times Equitiy \: Multiplier\]Each one of these represents a different part of the company
- Profit Margin is a measure of the firm’s operating efficiency
- Total Asset Turnover is a measure of the firm’s asset use efficiency
- Equity Multiplier is a measure of the firm’s financial leverage
Financial Models
Pro Forma Statements - project values for chanages to the income statement using Percentage of Sales Approach
- List all numbers as a percentage of sales
- Project the sales calue increas for the following year and match the rest to the projection
- Identify spontaneous accounts and list them as percentage of sales
- Project numbers that support growth in sales
- Calculate retained earnings for the new year given projected sales
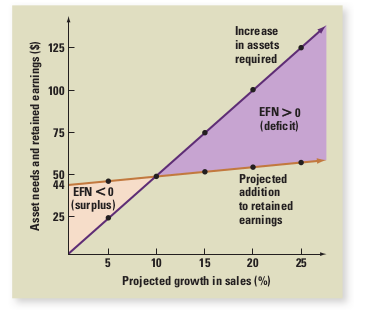
- Determine External Financing Needs that we will need to reach our sales projection by balancing the balance sheet
- Determine your plug variables and solve accordingly
Internal Growth Rate - \(G_{internal} = \frac{ROA \times Retention \: Ratio}{1- ROA \times Retention \: Ratio}\)
Sustainable Growth Rate - \(G_{sustain} = \frac{ROE \times Retention \: Ratio}{1- ROE \times Retention \: Ratio}\)
Discount Cash Flow Evaluation
- \[Net \: Present \: Value = -Cost + FV\]
- \[FV = Cost \times (1 + \frac{r}{m})^{mT}\]
- \[FV = Cost \times e^{rT}\]
- \[EAR = (1+ \frac{i}{p})^p -1\]
Here, \(r\) is the discount rate and \(g\) is the growth rate
Perpetuity - A constant stream of cash flow that lasts forever
- \[PV = \frac{C}{r-g}\]
Annuity - A constant stream of cash flows with a fixed maturity
- \[PV = \frac{C}{r-g} \times (1 - \frac{1+g}{1+r})^T\]
- \[FV = C \times \frac{(1+r)^{-T} -1}{r}\]
Making Capital Investment Decisions and Project Evaluation
\[Net \: Present \: Value = Total \: PV \: of \: future \: CFs + Initial \: Investment\] \[CF_{operating} = (revenue - costs) \times (1-tax) + Depreciaton \times tax\]- Payback Period - number of years to recover initial costs
- Discounted Payback Period - Payback period that takes the time value of money into account
- Internal Rate of Return - This is the discount rate that sets NPV to zero
- Profitability Index - meaures our return on every dollar of investment value
-
Incremental Profitability Index - Profitability index is prone to scale issues, so we take the difference between the two cash flows
- Sunk Costs - costs that already occured
- Opportunity Cost - the best alternative use of resources
- Fixed Costs - do not scale with the amount of goods produced
- Variable Costs - scale with the amount of good produced
- Salvage value - amount remaining after a depreciated useful life
Sensitivity, Scenario, and Break-Even Analysis
- Sensitivity Analysis - examines how sensitive a particular NPV calcuation is under best, optimistic, and pessimistic circumstances
- Scenario Analysis - examines a different number of likely scenarios, where each scenario is a confluence of factors
- Break-even Analysis - examine the increase of sales needed to break even. We can calculate this for Accounting Profit or for Present Value. In accounting profit, we do not account for tax because there isn’t any.
- \[Accounting \: Profit \: BE = \frac{Fixed \: Costs + Deprecation}{Sales \: price - Variable \: costs}\]
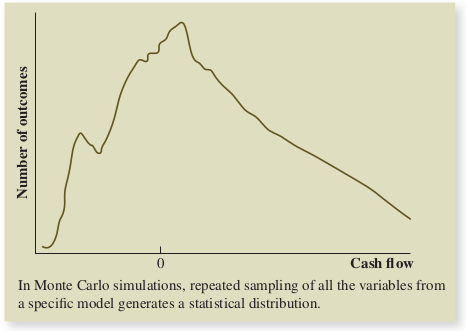
Monte Carlo Simulaiton
You can run repeated simulations, drawing one random choice at each time, simulating thousands of scenarios.